
Journal of Agricultural Big Data ›› 2023, Vol. 5 ›› Issue (2): 97-108.doi: 10.19788/j.issn.2096-6369.230215
Previous Articles Next Articles
WANG XueYing1,3( ), CHEN XianGuan1,2,*(), TANG ShunJie1, FENG LiPing1
Received:2022-07-26
Online:2023-06-26
Published:2023-08-15
Contact:
CHEN XianGuan
WANG XueYing, CHEN XianGuan, TANG ShunJie, FENG LiPing. Sensitivity Analysis and Adaptability Evaluation of RiceSM Model[J].Journal of Agricultural Big Data, 2023, 5(2): 97-108.
Table 1
Main parameters of RiceSM model"
| 参数 Parameters | 定义 Definition | 初始值 Initial values | 变化范围 Range of variation |
|---|---|---|---|
| K1 | 播种到出苗阶段基本发育系数 Basic development factor from sowing to seedling stage | -1.5 | -1.95~- 1.05 |
| K2 | 出苗到移栽阶段基本发育系数 Basic development factor from seedling to transplanting stage | -3.15 | -4.095~2.205 |
| K3 | 移栽到拔节阶段基本发育系数 Basic development factor from transplanting to jointing stage | -3.0 | -3.9~-2.1 |
| K4 | 拔节到孕穗阶段基本发育系数 Basic development coefficient from jointing to booting stage | -1.5 | -1.95~-1.05 |
| K5 | 孕穗到抽穗阶段基本发育系数 Basic development coefficient from booting to heading stage | -1.25 | -1.625~-0.875 |
| K6 | 抽穗到黄熟阶段基本发育系数 Basic development coefficient from heading to yellow ripening stage | -3.0 | -3.9~-2.1 |
| K7 | 黄熟到成熟阶段基本发育系数 Basic development coefficient from yellow ripening to ripening stage | -1.98 | -2.574~-1.386 |
| Pmax | 最大光合速率 Maximum photosynthetic rate | 4.0 | 2.8~5.2 |
| P1 | 播种到出苗阶段温度反应特性遗传系数 Temperature genetic coefficient from sowing to seedling stage | 0.9 | 0.63~1.17 |
| Q1 | 播种到出苗阶段光周期反应特性遗传系数 Light genetic coefficient from sowing to seedling stage | 1.157 | 0.8099~1.5041 |
| CLG1 | 移栽到拔节阶段根干物质的分配系数 Dry matter distribution coefficients of root from transplanting to jointing stage | 0.58 | 0.406~0.754 |
| CLT1 | 移栽到拔节阶段茎干物质的分配系数 Dry matter distribution coefficients of stem from transplanting to jointing stage | 0.02 | 0.014~0.026 |
| CLV1 | 移栽到拔节阶段叶干物质的分配系数 Dry matter distribution coefficients of leaf from transplanting to jointing stage | 0.4 | 0.28~0.52 |
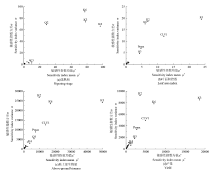
Fig. 1
Sensitivity analysis results of Morris method of RiceSM model"


Fig. 2
Sensitivity analysis results of EFAST method of RiceSM model"

Table 2
Sensitive parameters of RiceSM model"
| 输出变量 Output variables | 敏感性分析方法 Sensitivity analysis methods | 敏感参数 Sensitive parameters |
|---|---|---|
| 成熟期 Ripening stage | Morris | K2、K3、K6、Q2、K7 |
| EFAST | K3、K2、P2、Q2、K7、K6 | |
| 叶面积指数 Leaf area index | Morris | K3、CLV1、K2、K6、Pmax、Q3 |
| EFAST | K3、CLV1、K2、K6、Pmax、Q3 | |
| 地上部生物量 Above-ground biomass | Morris | K3、K6、CLV1、K2、Pmax、Q3、K4 |
| EFAST | K3、CLV1、K2、K6、Pmax、Q3、K4 | |
| 产量 Yield | Morris | K3、K6、CLV1、K2、Pmax、Q3、K4、K7 |
| EFAST | K3、K2、CLV1、K6、Q2、K7、Pmax、Q3、K4 |
Table 3
Results of basic development factors of RiceSM model"
| 站点 Site | 类型 Type | K2 | K3 | K4 | K6 | K7 | Q2 | Q3 | Pmax | CLV1 |
|---|---|---|---|---|---|---|---|---|---|---|
| 长沙 Changsha | 早稻 Early rice | -2.5 | -3.05 | -1.5 | -3.0 | -1.98 | 0.50 | 0.52 | 4.0 | 0.42 |
| 晚稻 Late rice | -3.0 | -3.00 | -1.5 | -3.0 | -1.50 | 0.49 | 0.51 | 4.0 | 0.43 | |
| 常德 Changde | 早稻 Early rice | -2.5 | -3.01 | -1.5 | -3.0 | -1.50 | 0.49 | 0.50 | 4.0 | 0.42 |
| 晚稻 Late rice | -3.0 | -3.00 | -1.5 | -3.0 | -2.15 | 0.52 | 0.50 | 4.0 | 0.40 |
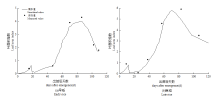
Fig. 3
Comparison of simulated and measured leaf area index of RiceSM model"

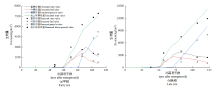
Fig. 4
Comparison of simulated and measured biomass"

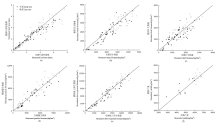
Fig. 5
Comparison between simulated and measured leaf area index, biomass, yield of early and late rice for validation"

Table 4
Statistical evaluation indicators of simulated and measured leaf area index, organ biomass, yield values of early and late rice"
| 项目 Project | N | Xobs±SD | Xsim±SD | P(t * ) | α | β | R2 | RMSE | NRMSE (%) | |
|---|---|---|---|---|---|---|---|---|---|---|
| 早稻 Early rice | 叶面积指数 Leaf area index | 82 | 2.5± 1.9 | 2.3± 1.6 | 0.43 | 0.83 | 0.21 | 0.94 | 0.54 | 21.63 |
| 茎生物量Stem biomass (kg/hm2) | 61 | 1 910.6± 1 193.4 | 1 536.2± 1 294.6 | 0.1 | 0.94 | -250.24 | 0.74 | 754.88 | 39.51 | |
| 叶生物量Leaf biomass (kg/hm2) | 61 | 1 210.4±733.2 | 994.9± 812. 1 | 0. 13 | 0.78 | 44.74 | 0.50 | 80.34 | 6.64 | |
| 穗生物量 Panicle biomass (kg/hm2) | 61 | 2 546.3±2 836.0 | 2 276.5±2 674.7 | 0.59 | 0.91 | -31.27 | 0.92 | 105.62 | 4. 15 | |
| 地上部生物量 Above-ground biomass (kg/hm2) | 61 | 5 663.0±4 064.9 | 4 801.1±4 364.0 | 0.26 | 1.02 | -1 001.39 | 0.91 | 199.29 | 3.52 | |
| 产量 Yield (kg/hm2) | 12 | 4 979.7± 1 029.0 | 5 196.2±999.0 | 0.61 | 0.81 | 1 173.45 | 0.69 | 603.50 | 12. 12 | |
| 晚稻 Late rice | 叶面积指数 Leaf area index | 82 | 3.4±2.3 | 2.8±2.0 | 0.10 | 0.66 | 0.59 | 0.60 | 1.59 | 47.00 |
| 茎生物量Stem biomass (kg/hm2) | 60 | 2 413.8± 1 460.6 | 2 048.7± 1 504.6 | 0.18 | 0.87 | -58.01 | 0.72 | 115. 14 | 4.77 | |
| 叶生物量Leaf biomass (kg/hm2) | 60 | 1 534.0± 860.7 | 1 396.6±952.4 | 0.41 | 0.84 | 113.75 | 0.57 | 83.75 | 5.46 | |
| 穗生物量 Panicle biomass (kg/hm2) | 60 | 3 080.0±3 320.2 | 3 336. 1±3 605.0 | 0.67 | 1.05 | 86.92 | 0.94 | 116.50 | 3.78 | |
| 地上部生物量 Above-ground biomass (kg/hm2) | 60 | 7 237.8±4 937.2 | 6 753. 1±5 449.2 | 0.61 | 1.06 | -944.36 | 0.93 | 200.87 | 2.78 | |
| 产量 Yield (kg/hm2) | 12 | 6139.9±342.0 | 6 432.6±582.4 | 0. 15 | 0.83 | 1 322.21 | 0.24 | 570.43 | 9.29 | |
| 注:N为样本数,Xobs为实测平均值、Xsim为模拟平均值、SD为标准差、P(t*)为t检验显著性、α、β、R2分别为模拟值与实测值 线性相关的斜率、截距、线性相关系数、RMSE 为均方根误差、NRMSE为归一化均方根误差。P(t*)中,*表示模拟值和实测值无 显著性差异的可信度为95%。 | ||||||||||
| [1] | 汪欢欢. 未来气候条件下水稻生产力模拟研究[D]. 南京: 南京农业大学, 2014. |
| Wang H H. Research on rice productivity simulation under future climate conditions[D]. Nanjing: Nanjing Agricultural University, 2014. (in Chinese) | |
| [2] | 殷新佑, 戚昌瀚. 水稻生长日历模拟模型及其应用研究[J]. 作物学报, 1994(3): 339. |
| Yin X Y, Qi C H. Rice growth calendar model and its application study[J]. Acta Agronomica Sinica, 1994(3): 339. (in Chinese) | |
| [3] | 高亮之, 金之庆. RCSODS-水稻栽培计算机模拟优化决策系统[J]. 计算机农业应用, 1993(3): 14-20. |
| Gao L Z, Jin Z Q. RCSODS-Computer simulation and optimization of rice cultivation decision system[J]. Computer Applications in Agriculture, 1993(3): 14-20. (in Chinese) | |
| [4] | 曹宏鑫, 金之庆, 石春林, 等. 中国作物模型系列的研究与应用[J]. 农业网络信息, 2006(5): 45-48, 51. |
| Cao H X, Jin Z Q, Shi C L, et al. Researches and application of crop model series in China[J]. Agriculture Network Information, 2006(5): 45-48, 51. (in Chinese) | |
| [5] | 王亚莉, 贺立源. 作物生长模拟模型研究和应用综述[J]. 华中农业大学学报, 2005, 24(5): 529-535. |
| Wang Y L, He L Y. A review on the research and application of crop simulation model[J]. Journal of Huazhong Agricultural University, 2005, 24(5): 529-535. (in Chinese) | |
| [6] | 叶芳毅, 李忠武, 李裕元, 等. 水稻生长模型发展及应用研究综述[J]. 安徽农业科学, 2009, 37(1): 85-89. |
| Ye F Y, Li Z W, Li Y Y, et al. Development and application of rice productivity models[J]. Journal of Anhui Agricultural Sciences, 2009, 37(1): 85-89. (in Chinese) | |
| [7] | 谭君位. 作物模型参数敏感性和不确定性分析方法研究[D]. 武汉: 武汉大学, 2017. |
| Tan J W. Study on parameter sensitivity and model uncertainty analysis of crop model[D]. Wuhan: Wuhan University, 2017. (in Chinese) | |
| [8] | 王连喜, 张阳, 李琪, 等. 作物模型参数敏感性分析现状与展望[J]. 气象科技, 2018, 46(2): 382-389. |
| Wang L X, Zang Y, Li Q, et al. Current status and prospects of sensitivity analysis of crop model parameter[J]. Meteorological Science and Technology, 2018, 46(2): 382-389. (in Chinese) | |
| [9] | 蔡毅, 邢岩, 胡丹. 敏感性分析综述[J]. 北京师范大学学报(自然科学版), 2008, 44(1): 9-16. |
| Cai Y, Xing Y, Hu D. On sensitivity analysis[J]. Journal of Beijing Normal University(Natural Science), 2008, 44(1): 9-16. (in Chinese) | |
| [10] |
邢会敏, 相诗尧, 徐新刚, 等. 基于EFAST方法的AquaCrop作物模型参数全局敏感性分析[J]. 中国农业科学, 2017, 50(1): 64-76.
doi: 10.3864/j.issn.0578-1752.2017.01.006 |
|
Xing H M, Xiang S Y, Xu X G, et al. Global sensitivity analysis of AquaCrop crop model parameters based on EFAST method[J]. Scientia Agricultura Sinica, 2017, 50(1): 64-76. (in Chinese)
doi: 10.3864/j.issn.0578-1752.2017.01.006 |
|
| [11] | 谢松涯, 张宝忠. 基于全局敏感性分析的WOFOST模型参数优化[J]. 中国农村水利水电, 2018, 434(12): 29-34. |
| Xie S Y, Zhang B Z. Optimization of WOFOST model parameters based on global sensitivity analysis[J]. China Rural Water and Hydropower, 2018, 434(12): 29-34. (in Chinese) | |
| [12] | 宋明丹, 冯浩, 李正鹏, 等. 基于Morris和EFAST的CE-RES- Wheat模型敏感性分析[J]. 农业机械学报, 2014, 45(10): 124-131, 166. |
| Song M D, Feng H, Li Z P, et al. Global sensitivity analyses of DSSAT-CERES-Wheat model using Morris and EFAST methods[J]. Journal of Agricultural Machinery, 2014, 45(10): 124-131, 166. (in Chinese) | |
| [13] | 胡钧铭, 江立庚, 吕永成. 水稻模拟模型研究与发展趋势[J]. 农业网络信息, 2007,(4): 7-10, 17. |
| Hu J M, Jiang L G, Lv Y C. Research and development tendency of simulation and model in rice[J]. Agriculture Network Information, 2007,(4): 7-10, 17. (in Chinese) | |
| [14] | 高蓓, 胡凝, 高茂盛. 水稻ORYZA2000模型在陕西省的适应性评价[J]. 西南师范大学学报(自然科学版), 2016, 41(5): 74-80. |
| Gao B, Hu N, Gao M S. On adaptability evaluation of ORY -ZA2000 in Shanxi province[J]. Journal of Southwest China Normal University(Natural Science), 2016, 41(5): 74-80. (in Chinese) | |
| [15] | 姚凤梅, 许吟隆, 冯强, 等. CERES-Rice模型在中国主要水稻生态区的模拟及其检验[J]. 作物学报, 2005, 31(5): 545-550. |
| Yao F M, Xu Y L, Feng Q, et al. Simulation and validation of CERES-Rice model in main rice ecological zones in China[J]. Acta Agronomica Sinica, 2005, 31(5): 545-550. (in Chinese) | |
| [16] | 郭建茂, 王星宇, 刘慎彬, 等. 基于稻田实测温度的水稻模型ORYZA2000应用[J]. 中国农业气象, 2020, 41(4): 211-221. |
| Guo J M, Wang X Y, Liu S B, et a1. Application of rice model ORYZA2000 based on measured temperature in rice fields[J]. Chinese Journal of Agrometeorology, 2020, 41(4): 211-221. (in Chinese) | |
| [17] | 汤顺杰. 水稻生长模拟模型系统(RiceSM)软件设计[D]. 北京: 中国农业大学, 2022. |
| Tang S J. Rice growth simulation model system (RiceSM) software design[D]. Beijing: China Agricultural University, 2022. (in Chinese) | |
| [18] |
Morris M. Factorial Sampling plans for preliminary computational experiments[J]. Technometrics, 1991, 33(2): 161-174.
doi: 10.1080/00401706.1991.10484804 |
| [19] | Campolongo F, Cariboni J, Saltelli A. An effective screening design for sensitivity analysis of large models[J]. Environmental Modelling & Software, 2007, 22(10): 1509-1518. |
| [20] | 史鑫蕊, 梁浩, 周丰, 等. 稻田土壤—作物系统模型参数敏感性分析与模型验证[J]. 农业机械学报, 2020, 51(5): 252-262, 271. |
| Shi X H, Liang H, Zhou F, et al. Sensitivity analysis and parameter estimation for soil-rice system model[J]. Transactions of the Chinese Society for Agricultural Machinery, 2020, 51(5): 252-262, 271. (in Chinese) | |
| [21] | Saltelli A, Tarantola S, Campolongo F, Ratto M. Sensitivity analysis in practice: A guide to assessing scientific models[M]. John Wiley and Sons, 2004: 20-78. |
| [22] | 孟怡君, 邱小雷, 刘蕾蕾, 等. RiceGrow 水稻模型品种参数敏感性分析[J]. 农业大数据学报, 2021, 3(3): 23-32. |
| Meng Y J, Qiu X L, Liu L L, et al. Sensitivity analysis of genetic parameters of RiceGrow model[J]. Journal of Agricultural Big Data, 2021, 3(3): 23-32. (in Chinese) | |
| [23] | 曹秀霞, 安开忠, 蔡伟, 等. CERES-Rice模型在江汉平原的验证与适应性评价[J]. 中国农业气象, 2013, 34(4): 447-454. |
| Cao X X, An K Z, Cai W, et al. Validation and adaptability evaluation of CERES-Rice model in the Jianghan plain[J]. Chinese Journal of Agrometeorology, 2013, 34(4): 447-454. (in Chinese) |
| [1] | KONG FanTao, AN Min, SUN Wei, LIU JiFang, HU Lin, CAO ShanShan. A Dataset of the Statistics on Tomato Transaction Price in the Wholesale Market in Beijing-Tianjin-Hebei Region from 2012 to 2019 [J]. Journal of Agricultural Big Data, 2023, 5(2): 62-67. |
| [2] | ZHANG HaiFeng, ZHANG Yu, LAI YongCai, ZHENG YanYan, LIU Kai, BI HongWen. Construction and Application of Monitoring Platform for Saline-alkali Land in Cold Regions [J]. Journal of Agricultural Big Data, 2023, 5(2): 122-131. |
| [3] | WANG BoYuan, GUAN ZhiHao, YANG Yang, HU Lin, WANG XiaoLi. The Agricultural Pest and Disease Image Recognition Dataset in Nanjing, Jiangsu Province, in 2023 [J]. Journal of Agricultural Big Data, 2023, 5(2): 91-96. |
| [4] | JIN Yuze, JIA Xinwei, LAI Wangfeng, ZHOU Hongli, CHEN Naihe, LI Tao. Exploration and Application of Big Data Technology in Pork Price Prediction and Regulation [J]. Journal of Agricultural Big Data, 2023, 5(1): 126-134. |
| [5] | GUAN Bolun, DONG Wei, ZHANG Liping, YANG Qianjin, WANG Yan. Development and Application of Traceability Tracking Platform for Ratooning Rice [J]. Journal of Agricultural Big Data, 2023, 5(1): 55-67. |
| [6] | Yijun Meng, Xiaolei Qiu, Leilei Liu, Bing Liu, Yan Zhu, Weixing Cao, Liang Tang. Sensitivity Analysis of Genetic Parameters of RiceGrow Model [J]. Journal of Agricultural Big Data, 2021, 3(3): 23-32. |
| [7] | Ayitula Maimaitizunong, Shuai Yanju, Haodong Wei, Zhen He, Qinxi Xiao, Qiong Hu, Baodong Xu, Liangzhi You, Cougui Cao, Lin Ling. Evaluation of Green Development of Rice-Based Cropping Systems Using Remote Sensing Data and the DNDC Model: Case Study of Qianjiang City [J]. Journal of Agricultural Big Data, 2021, 3(3): 33-44. |
| [8] | Juan Yang, Tingting Qian, Xiuguo Zheng, Jingyin Zhao, Yeying Xu. Analysis on Transmission Mechanism of Short-Term Fluctuation of Vegetable Prices: An Example Study of Pak Choi in Shanghai [J]. Journal of Agricultural Big Data, 2020, 2(3): 31-41. |
| [9] | Hebing Liu, Jingjing Han, Xinming Ma, Lei Xi. Research on Agricultural Product Price Prediction Based on the EMD-ELM Mode [J]. Journal of Agricultural Big Data, 2020, 2(3): 68-74. |
| [10] | Xiaoyan Zhang, Li Meng, Lili Wang, Feng Liu, Jiajia Liu, Decheng Lu. Analysis of the Price Fluctuation Characteristics of China’s Wheat Market Using Big Data: A Case Study of Shandong Province [J]. Journal of Agricultural Big Data, 2020, 2(3): 75-83. |
| [11] | Guoxin Dai,Guoxin Chen,Wanneng Yang,Hui Feng. Measurement Technology of Quality Parameters of Rice Grain Based on Hyperspectral Imaging on the Visible-near Infrared [J]. Journal of Agricultural Big Data, 2019, 1(2): 51-63. |
|
||